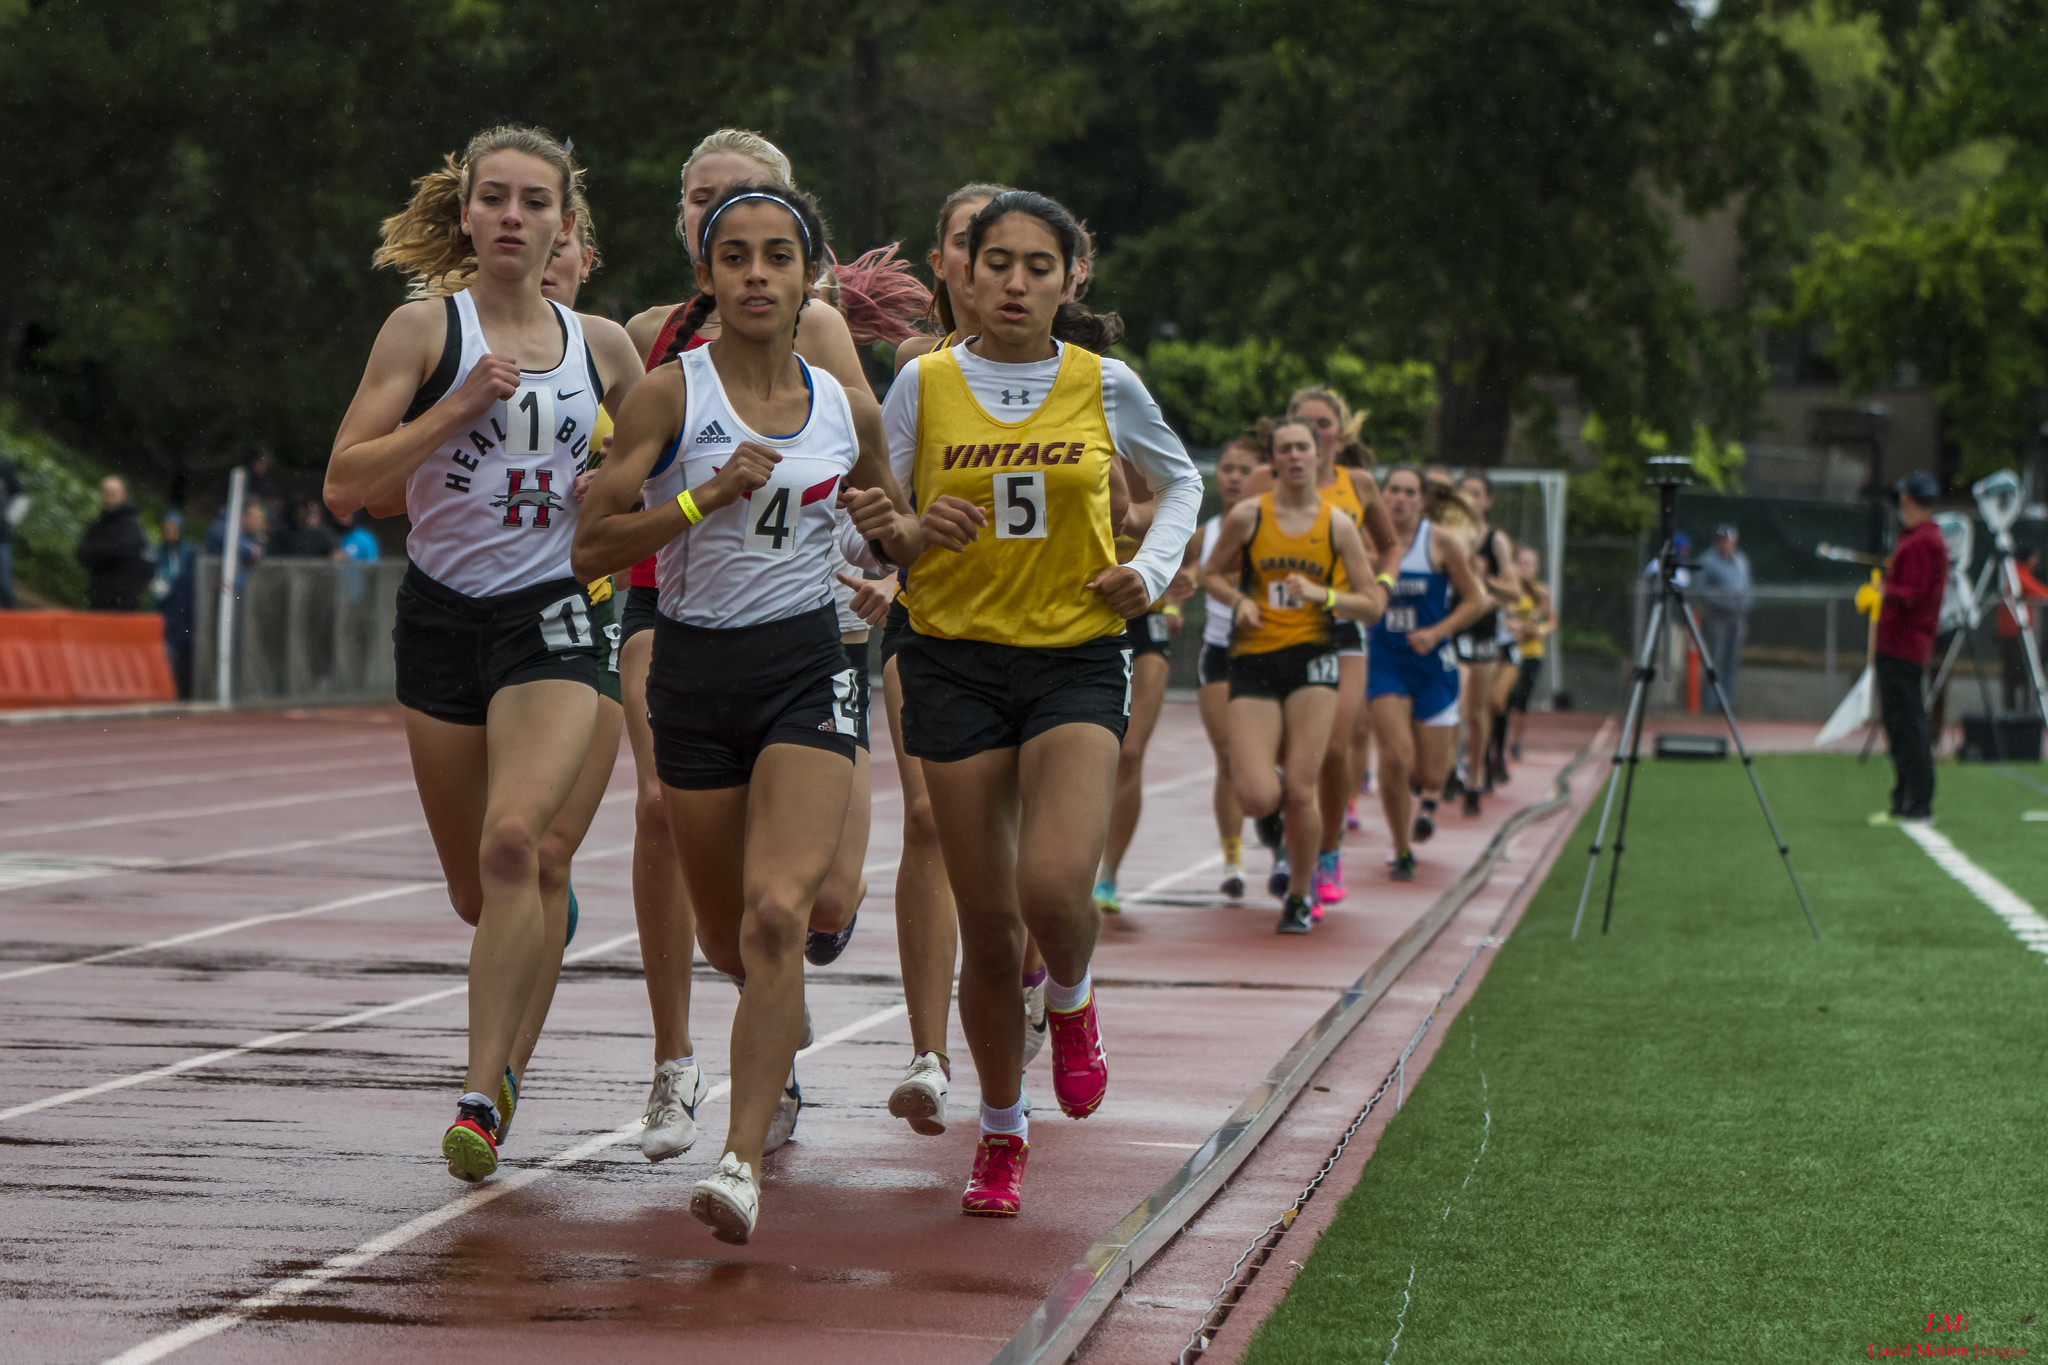
Congratulations 2019 girls you produced more outstanding marks than any other year.

The 2019 season averaged 3.6 top notch marks per event bettering the previous best by the 2015 group.
The 1992 season, 28 years ago, is the only group from the last millennium to make it into the top 10 best years.
One thing I noticed while compiling this is the difference between the boys and girls seasons.
For the boys it is fairly rare for a frosh/soph to produce a mark that makes these lists. Therefore every year or two it is a totally different group of boys that make up the marks for that season.
For the girls it is fairly common for a girl who can produce such a mark to typically do it all three or four of her years, so the difference between one season and the years before or after are not usually very different.
Basically each decade in the girls has been far better than the previous decade.
Decade    Average, low-high
2010-2019 45.7, 31-58
2000-2009 41.8, 28-51
1990-1999 31.4, 22-48
1980-1989 26.0, 16-40
1976-1979 14.6, 7.4-22.7
The years with marks with decimal places are from years before all 16 events were contested. In those years and I averaged the marks they had by events offered to even things out.
* Qualifying marks are roughly what it takes to make the All-Time Top 50, actual marks listed near the bottom of the page.
Greater explanation of these rankings
Boys Season Rankings by Marks
Complete stats
As of 6/20/2022, going back to 1975.
Bolded years are best for that decade.
Year    Marks   Best events for those years
2019	57      PV 7, 800, 3200 & TJ 6
2015	53      100HH 6, 200, 300H & DT 5
2003	51      400 6, 1600 & 200 5
2010	50      HJ 7, PV 6
2013	50      SP 6, 300H & 100H 5
1992	48      HJ 6, TJ 5
2004	48      200 & HJ 6
2002	47
2016	47
2005	46

1997	44
2001	44
2012	43
2018	43
2000	42
1981	41.1
2017	40
2022    40
2011	39
2008	36
2006	35
2009	34
1999	33
1986	32
1996	32
1998	32
1980	30.8
2014	30
2007	28
1985	27.7
1991	27.7
1982	26.7
1994	25.6
1987	24.5
1993	24.5
1990	23.5
2021    23
1976	22.7
1995	22
1988	20.3
1989	20.3
1984	19.2
1979	16
1983	16
1978	12.3
2020	11
1977	 7.4
1975	 1


Event standard
These marks are roughly what it takes to make the All-Time top 50
        FAT   Hand Yards
100	12.64 12.4 11.3y
200	26.24 26.0 26.1y
400	59.40 59.1 59.4y
800	2:20.04 2:19.8 2:20.6y
1600	5:11.14 5:10.9 5:12.7y
3200	11:19.99 11:19.7 11:23.7y
110HH	16.42 16.1 ?15.9LH 80y
300IH	47.99 47.7 47.9y
400R	50.44 50.2 50.5y
1600R	4:08.24 4:08.0 4:09.4y
HJ	5' 2"
PV	9' 6"
LJ	17'
TJ	34' 6"
SP	36' 4k, 39-6 8LB
DT	115'

Events changed from yards to metrics in 1981.
80yd Low Hurdles to 110yd Low Hurdles in 1977
110yd Low Hurdles to 100m Lows in 1981
100m Lows to 100m High's in 1993
8 lb Shot Put to 4k SP in 1980
3200 event began in 1977
300LH event began in 1981
TJ event began in 1982
PV event began in 1995